MTBench: A Multimodal Time Series Benchmark for Temporal Reasoning and Question Answering
Introduction
News influences the world around us—from stock markets reacting to financial reports to temperature trends following extreme weather events. However, understanding this impact is not straightforward. While AI models are improving at handling both text and numbers, most datasets fail to test how well they connect these different types of data.
To address this, we introduce MTBench (Multimodal Time Series Benchmark), a dataset designed to evaluate how well AI models understand the relationship between text and time-series data. MTBench pairs financial news with stock market movements and weather reports with historical temperature changes. Unlike existing benchmarks that focus on text or numbers separately, MTBench challenges models to analyze both together, helping to assess their ability to detect trends, interpret news, and make predictions.
- Finance: Two datasets, each with 20K news articles paired with stock time-series data.
- Weather: 2K news and time-series pairs from 50 weather stations across the U.S. (see Figure 1).
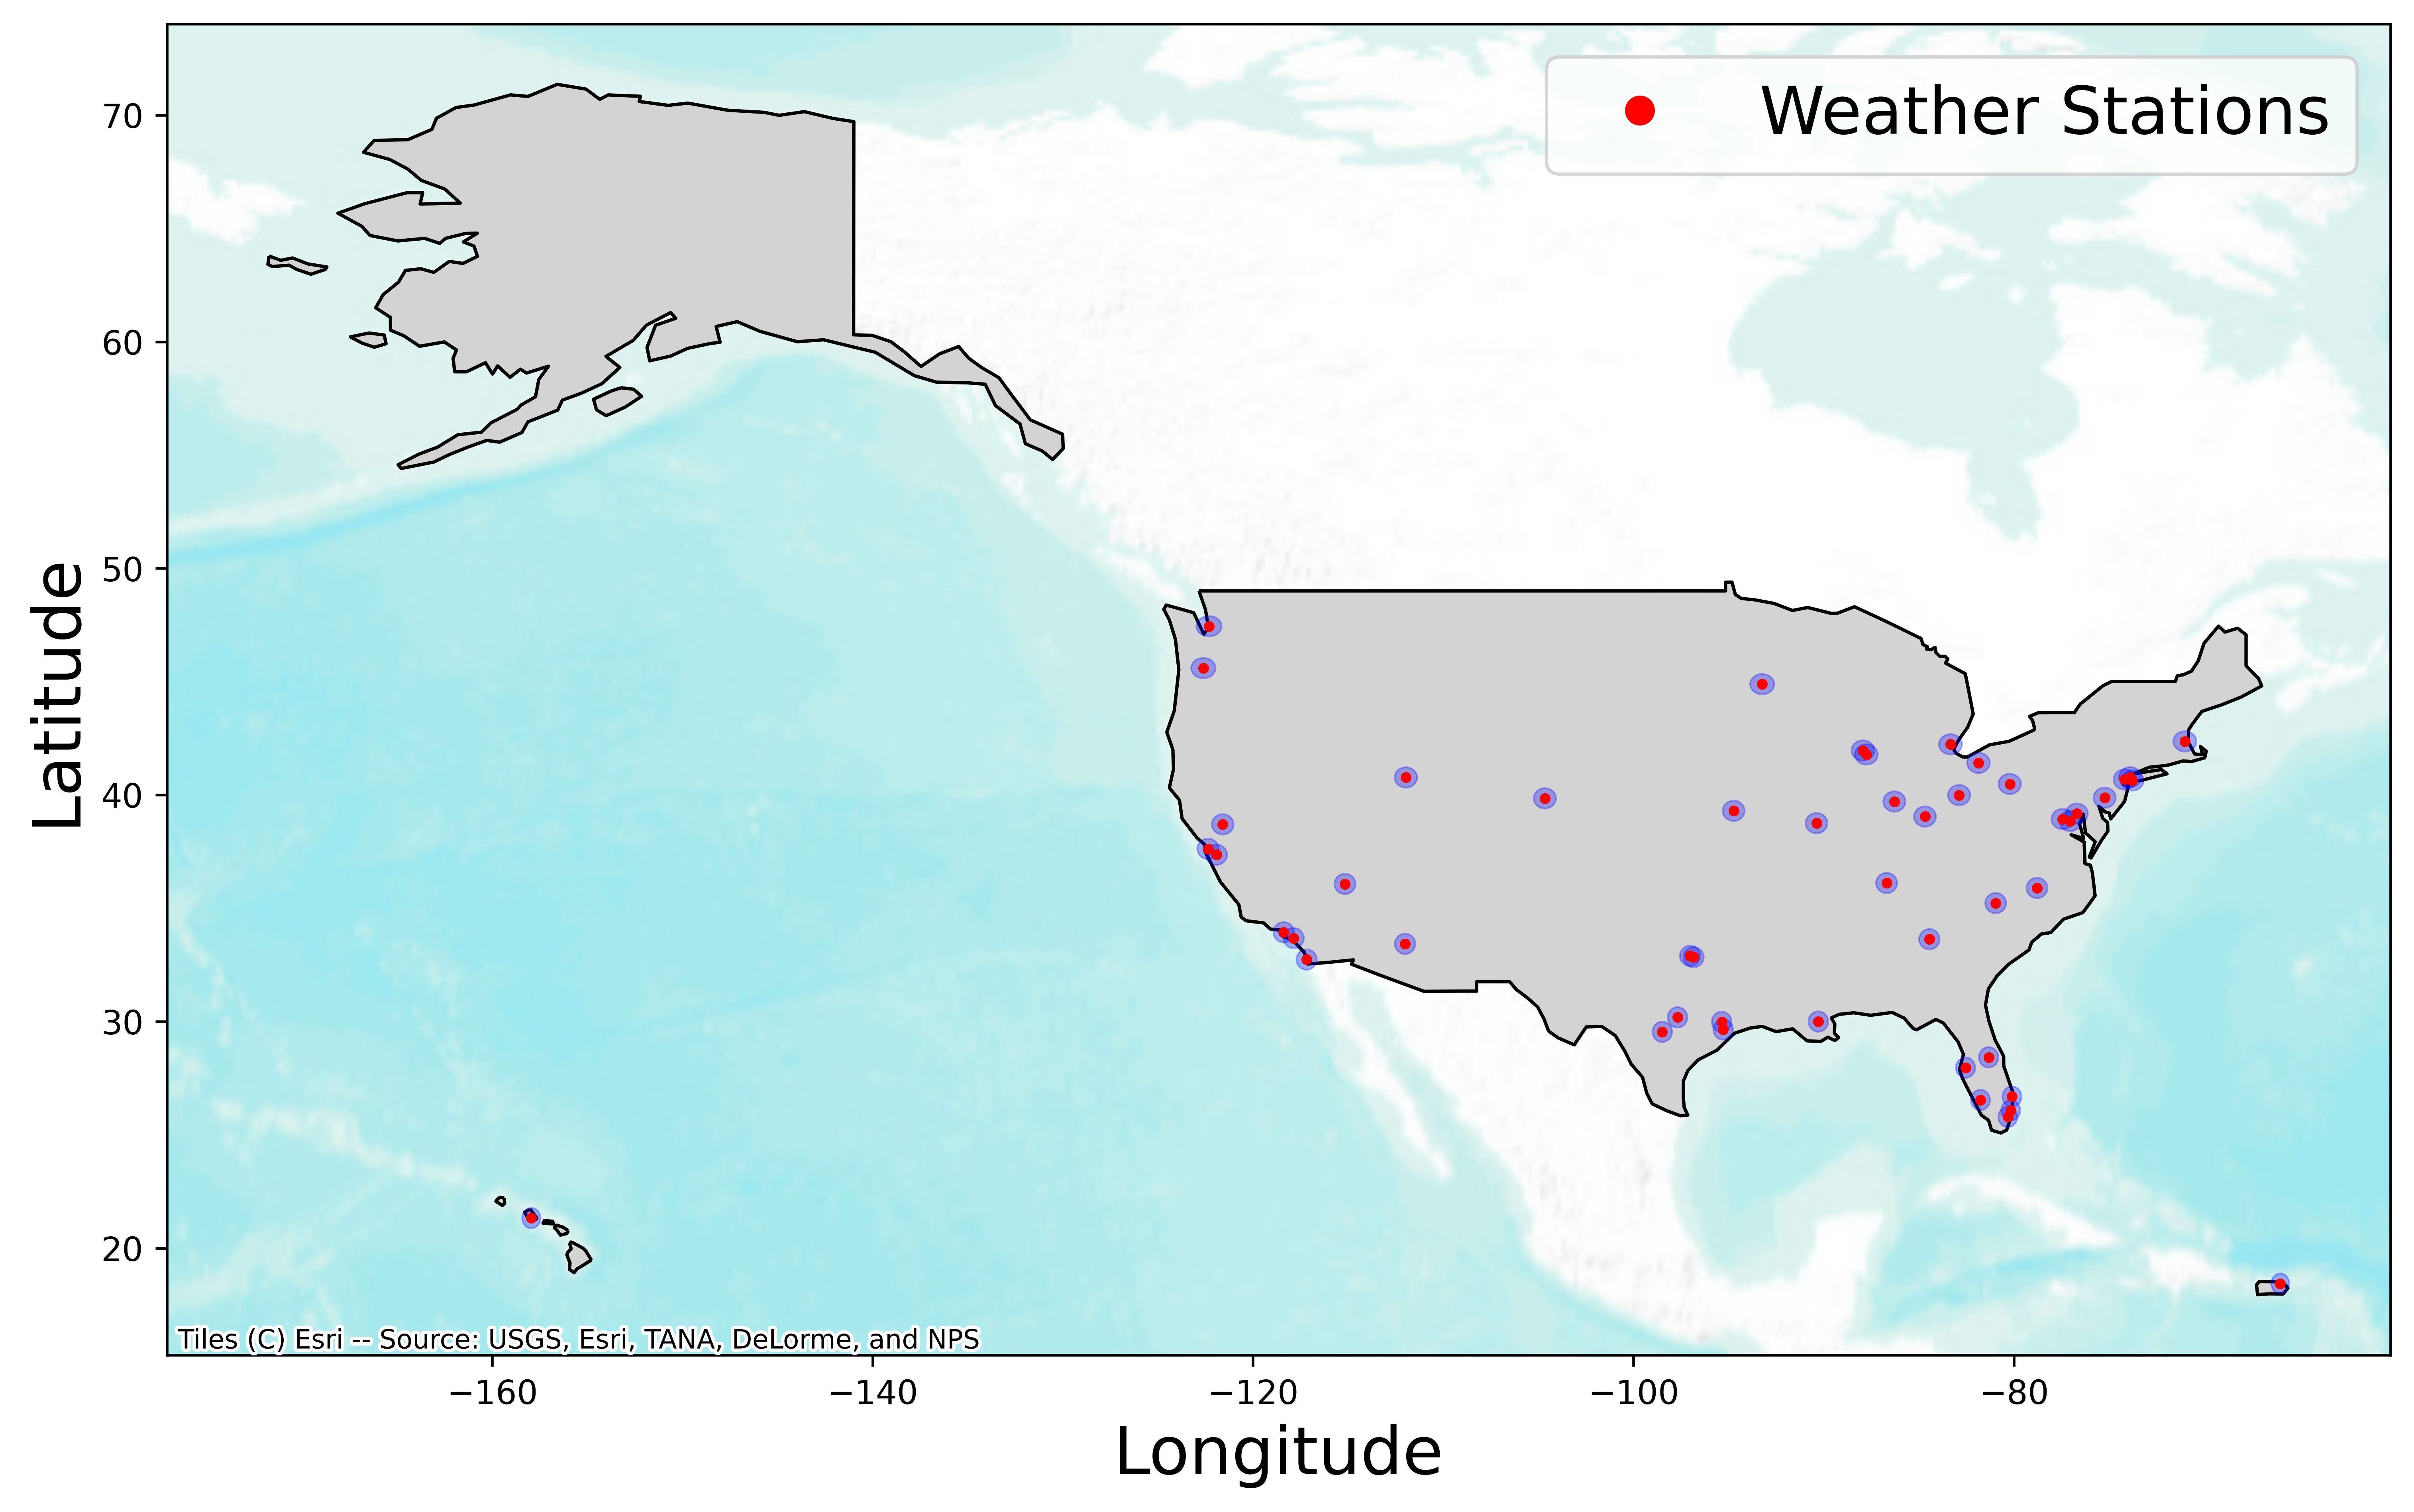 Figure 1. Geographical distribution of weather stations
As shown in Figure 2, MTBench enables a range of complex reasoning tasks beyond simple forecasting, including semantic trend analysis, technical indicator prediction, and news-driven Q&A. These tasks challenge LLMs to integrate numerical patterns with contextual information.
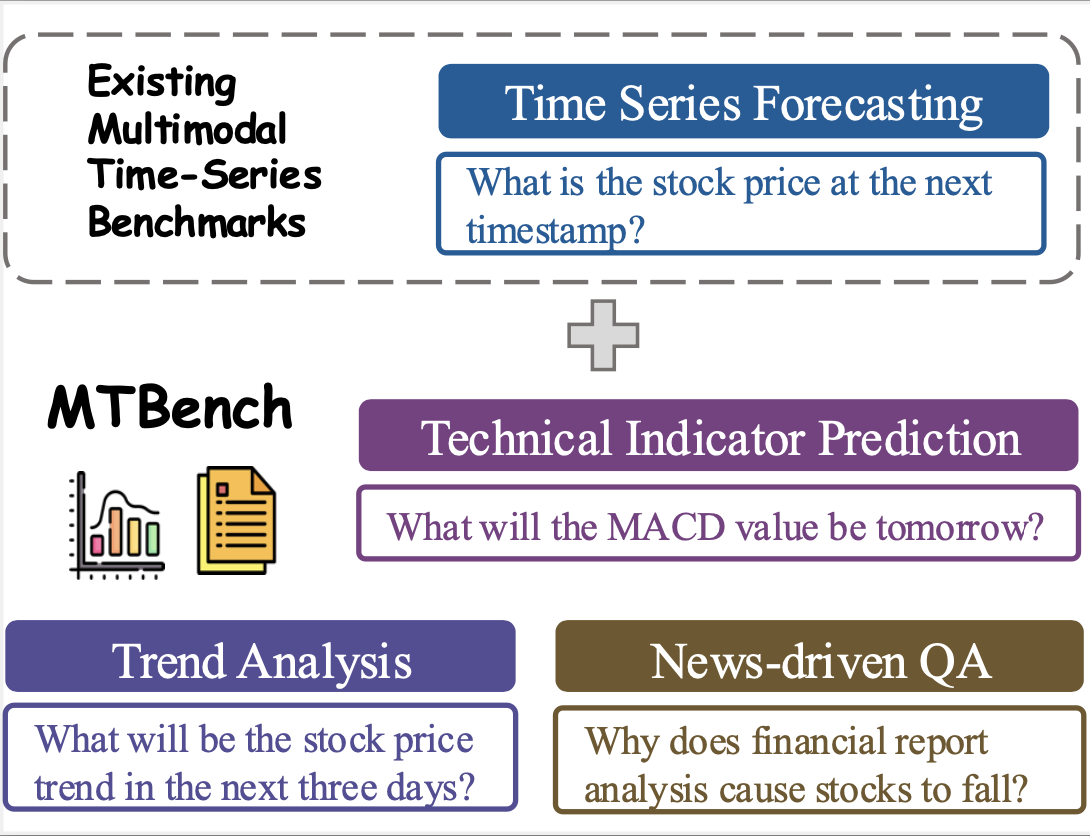 Figure 2. An overview of tasks in MTBench
Time-Series Forecasting
This task aims to forecast time-series values from historical data, optionally incorporating news articles. We assess short- and long-term forecasting: finance uses 30 days of historical data, while weather forecasting relies on 14 days to predict the next 3, reflecting shorter memory dynamics.
Semantic Trend Analysis
For this task we analyze time-series trends by computing the percentage change between input and output data, categorizing results into discrete trend labels (see example in Figure 3). This helps evaluate directional movement and model accuracy.
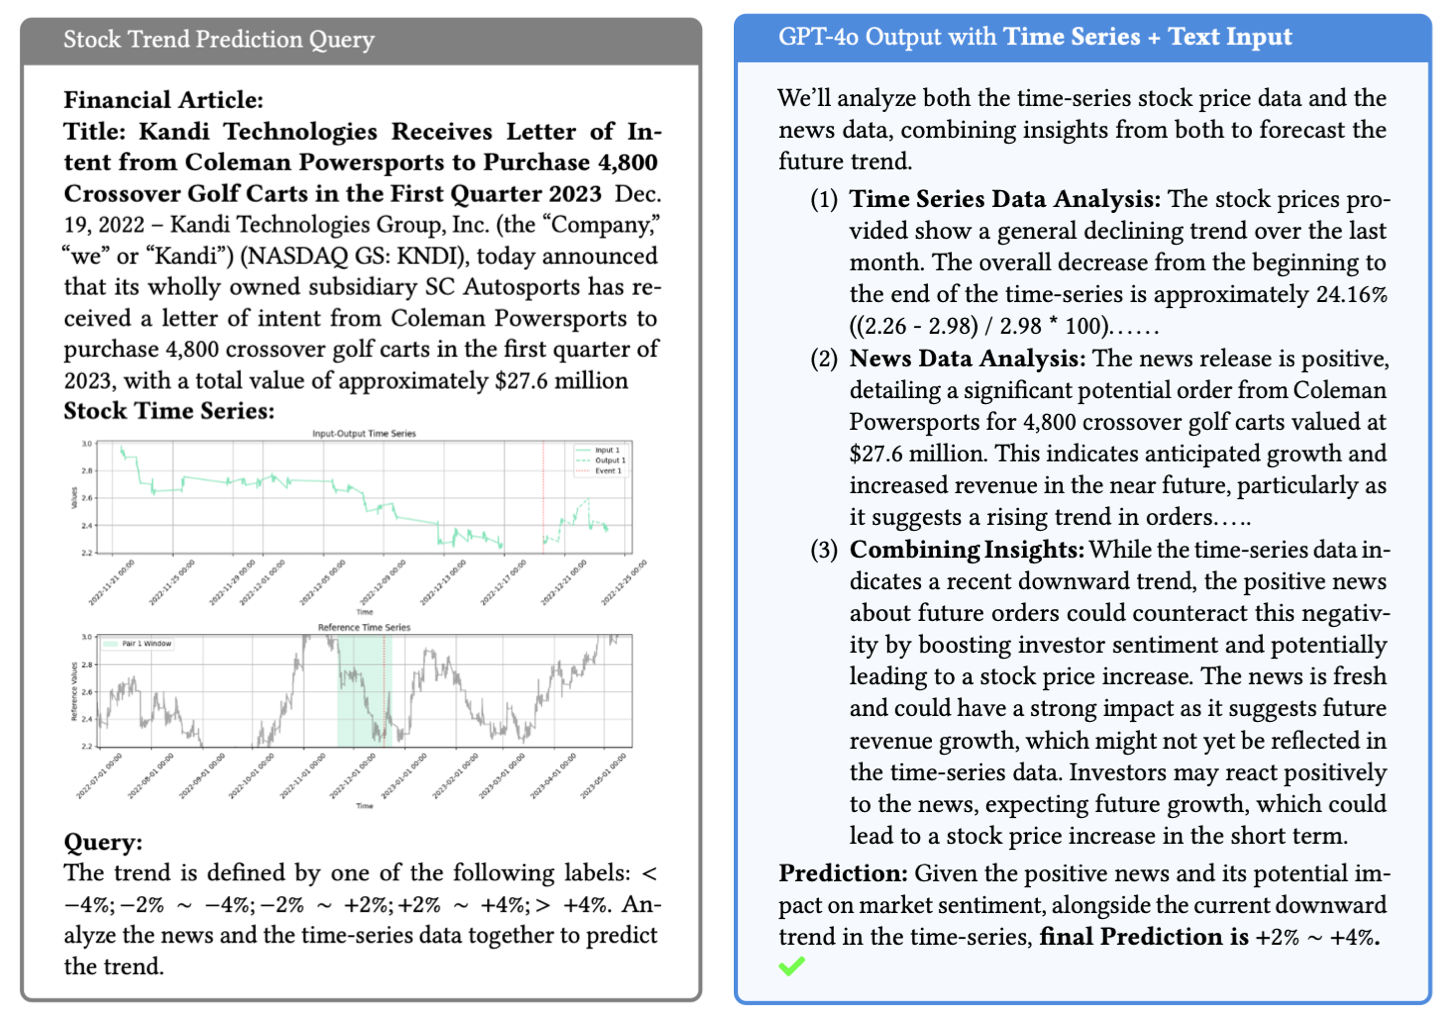 Figure 3. An Example of Stock Trend Prediction
Technical Indicator Prediction
This task evaluates the model’s ability to predict financial and weather metrics by forecasting key indicators from the output time-series, providing deeper insights beyond basic price or temperature predictions.
News-driven Question Answering
The news-driven QA task includes two sub-tasks: correlation prediction and multi-choice QA. As shown in Figure 4, this task requires models to analyze both text and time-series data, understanding the news content while predicting its potential impact on future trends based on historical time-series.
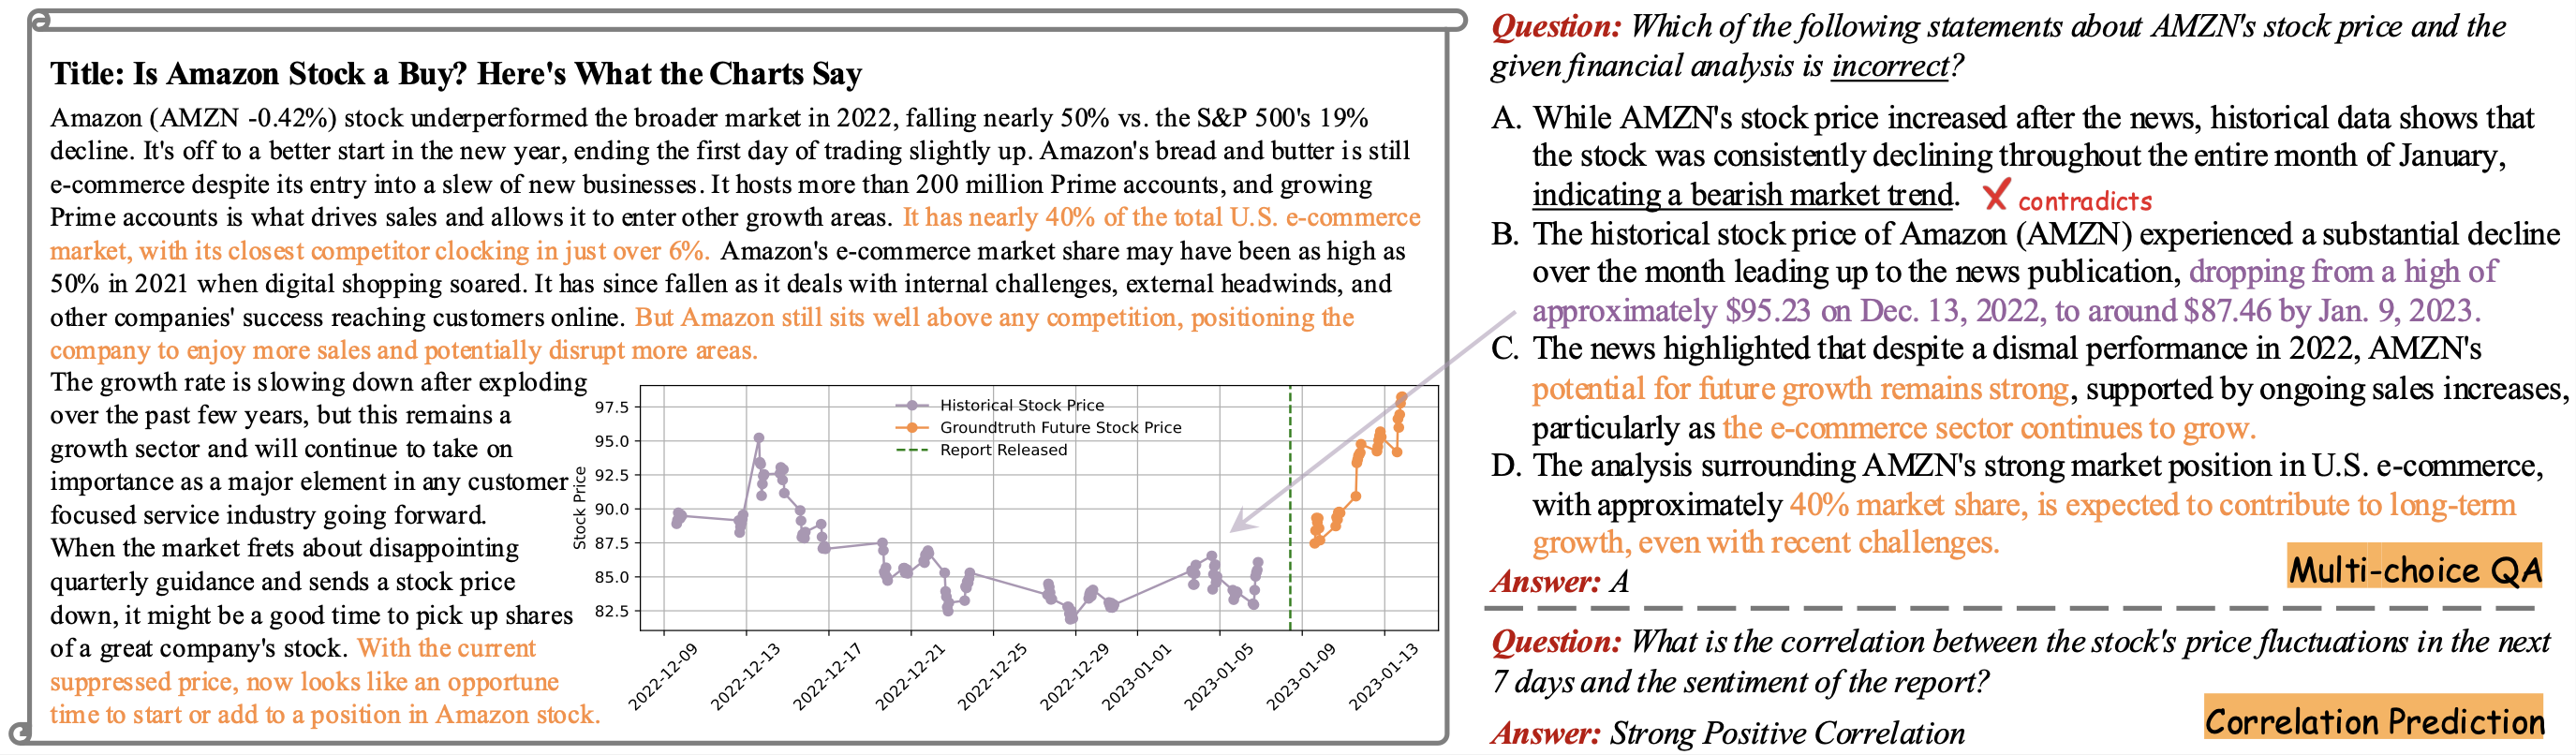 Figure 4. An Example of Multi-choice QA and Correlation Prediction on Finance Dataset
Figure 5 illustrates examples of the aforementioned tasks using the weather dataset.
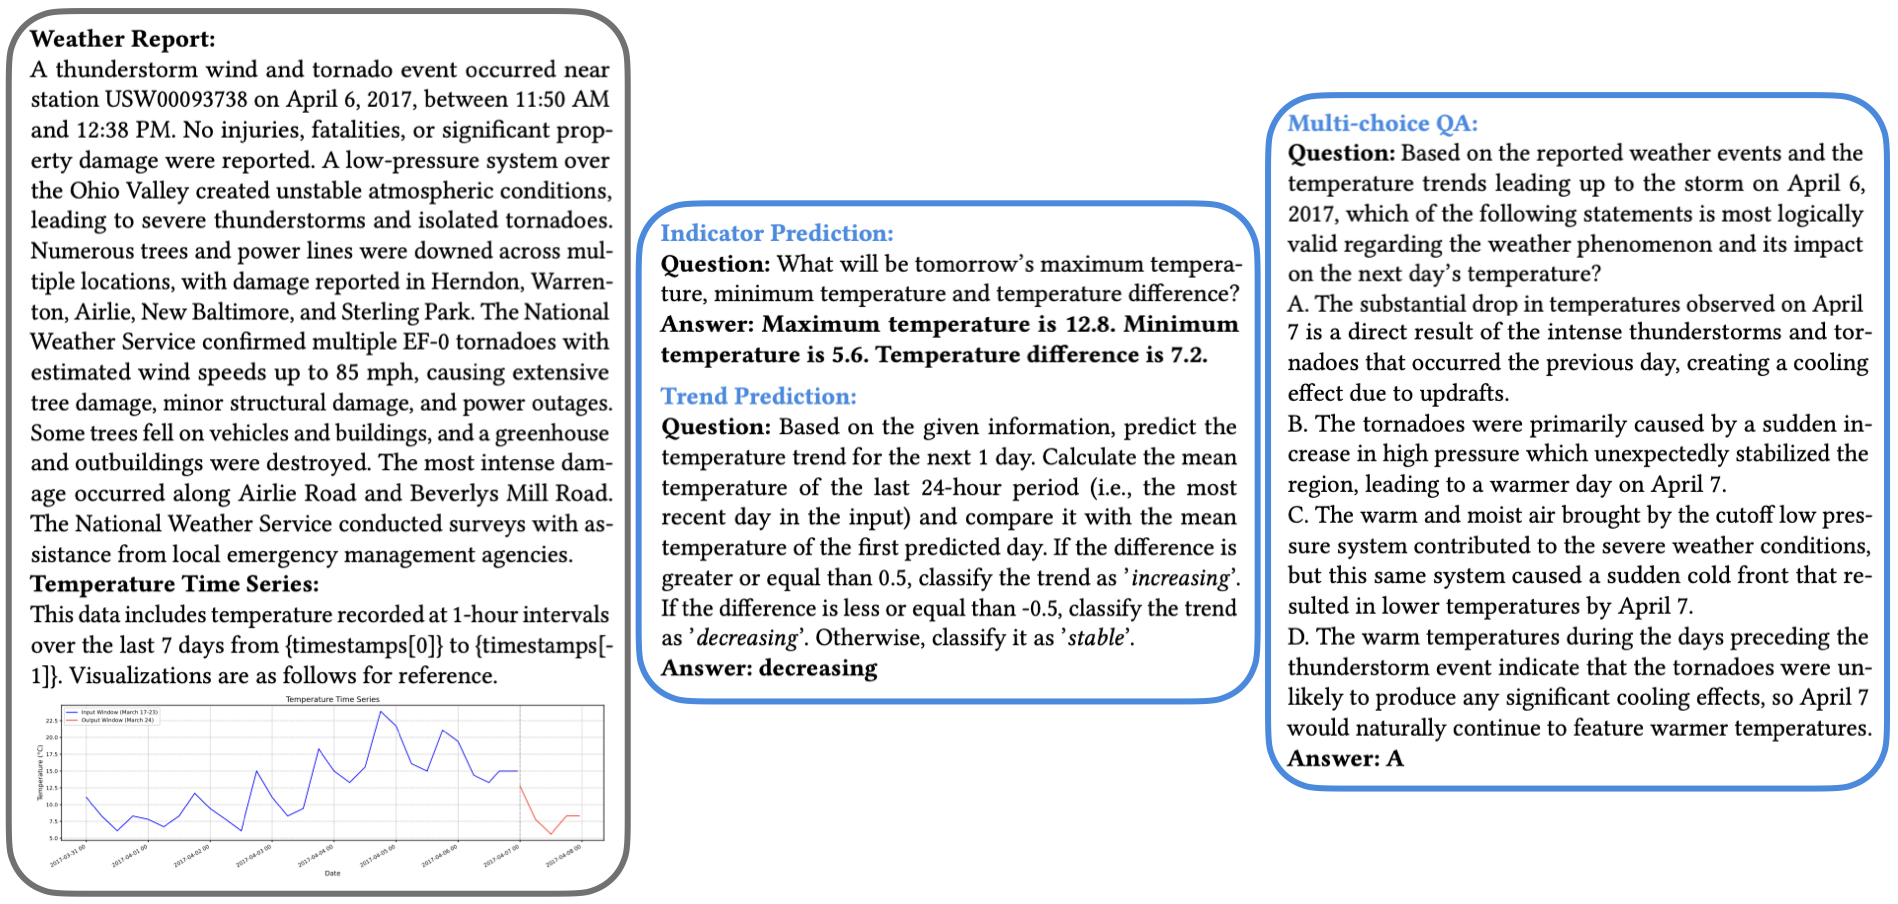 Figure 5. An Example of Technical Indicator Prediction, Trend Prediction and Multi-Choice QA on Weather Dataset
Various state-of-the-art large language models (LLMs) were evaluated on MTBench to measure their ability to link news with time-series trends (see Leaderboard). The results reveal key challenges—models struggle with long-term pattern recognition, cause-and-effect relationships, and seamlessly combining insights from text and numbers.
Leaderboard
| Model | Stock price prediction for 7 days under TS (MAE) | Stock price prediction for 7 days under TS+Text (MAE) | Stock price prediction for 7 days under TS (MAPE) | Stock price prediction for 7 days under TS+Text (MAPE) | Stock price prediction for 30 days under TS (MAE) | Stock price prediction for 30 days under TS+Text (MAE) | Stock price prediction for 30 days under TS (MAPE) | Stock price prediction for 30 days under TS+Text (MAPE) | Temp. prediction for 7 days under TS (MSE) | Temp. prediction for 7 days under TS+Text (MSE) | Temp. prediction for 7 days under TS (MAE) | Temp. prediction for 7 days under TS+Text (MAE) | Temp. prediction for 14 days under TS (MSE) | Temp. prediction for 14 days under TS+Text (MSE) | Temp. prediction for 14 days under TS (MAE) | Temp. prediction for 14 days under TS+Text (MAE) | Stock trend prediction for 7 days 3-way under TS (Acc) | Stock trend prediction for 7 days 3-way under TS+Text (Acc) | Stock trend prediction for 7 days 5-way under TS (Acc) | Stock trend prediction for 7 days 5-way under TS+Text (Acc) | Stock trend prediction for 30 days 3-way under TS (Acc) | Stock trend prediction for 30 days 3-way under TS+Text (Acc) | Stock trend prediction for 30 days 5-way under TS (Acc) | Stock trend prediction for 30 days 5-way under TS+Text (Acc) | Temp. trend prediction past under TS (Acc) | Temp. trend prediction past under TS+Text (Acc) | Temp. trend prediction future under TS (Acc) | Temp. trend prediction future under TS+Text (Acc) | MACD prediction for 7 days under TS (MSE) | MACD prediction for 7 days under TS+Text (MSE) | Bollinger Bands prediction for 7 days under TS (MSE) | Bollinger Bands prediction for 7 days under TS+Text (MSE) | MACD prediction for 30 days under TS (MSE) | MACD prediction for 30 days under TS+Text (MSE) | Bollinger Bands prediction for 30 days under TS (MSE) | Bollinger Bands prediction for 30 days under TS+Text (MSE) | Temp. prediction max under TS (MSE) | Temp. prediction max under TS+Text (MSE) | Temp. prediction max under TS (MAE) | Temp. prediction max under TS+Text (MAE) | Temp. prediction min under TS (MSE) | Temp. prediction min under TS+Text (MSE) | Temp. prediction min under TS (MAE) | Temp. prediction min under TS+Text (MAE) | Temp. prediction diff. under TS (MSE) | Temp. prediction diff. under TS+Text (MSE) | Temp. prediction diff. under TS (MAE) | Temp. prediction diff. under TS+Text (MAE) | News stock corr. for 7 days 3-way (Acc) | News stock corr. for 7 days 5-way (Acc) | News stock corr. for 30 days 3-way (Acc) | News stock corr. for 30 days 5-way (Acc) | News driven MCQA for 7 days for Finance data (Acc) | News driven MCQA for 7 days for Weather data (Acc) | News driven MCQA for 30 days for Finance data (Acc) | News driven MCQA for 30 days for Weather data (Acc) | |
|---|---|---|---|---|---|---|---|---|---|---|---|---|---|---|---|---|---|---|---|---|---|---|---|---|---|---|---|---|---|---|---|---|---|---|---|---|---|---|---|---|---|---|---|---|---|---|---|---|---|---|---|---|---|---|---|---|---|
Loading... | |||||||||||||||||||||||||||||||||||||||||||||||||||||||||
Leaderboard for Time-Series Forecasting
| Model | Stock price prediction for 7 days under TS (MAE) | Stock price prediction for 7 days under TS+Text (MAE) | Stock price prediction for 7 days under TS (MAPE) | Stock price prediction for 7 days under TS+Text (MAPE) | Stock price prediction for 30 days under TS (MAE) | Stock price prediction for 30 days under TS+Text (MAE) | Stock price prediction for 30 days under TS (MAPE) | Stock price prediction for 30 days under TS+Text (MAPE) | Temp. prediction for 7 days under TS (MSE) | Temp. prediction for 7 days under TS+Text (MSE) | Temp. prediction for 7 days under TS (MAE) | Temp. prediction for 7 days under TS+Text (MAE) | Temp. prediction for 14 days under TS (MSE) | Temp. prediction for 14 days under TS+Text (MSE) | Temp. prediction for 14 days under TS (MAE) | Temp. prediction for 14 days under TS+Text (MAE) | |
|---|---|---|---|---|---|---|---|---|---|---|---|---|---|---|---|---|---|
Loading... | |||||||||||||||||
Leaderboard for Trend Prediction
| Model | Stock trend prediction for 7 days 3-way under TS (Acc) | Stock trend prediction for 7 days 3-way under TS+Text (Acc) | Stock trend prediction for 7 days 5-way under TS (Acc) | Stock trend prediction for 7 days 5-way under TS+Text (Acc) | Stock trend prediction for 30 days 3-way under TS (Acc) | Stock trend prediction for 30 days 3-way under TS+Text (Acc) | Stock trend prediction for 30 days 5-way under TS (Acc) | Stock trend prediction for 30 days 5-way under TS+Text (Acc) | Temp. trend prediction past under TS (Acc) | Temp. trend prediction past under TS+Text (Acc) | Temp. trend prediction future under TS (Acc) | Temp. trend prediction future under TS+Text (Acc) | |
|---|---|---|---|---|---|---|---|---|---|---|---|---|---|
Loading... | |||||||||||||
Leaderboard for Technical Indicator Calculation
| Model | MACD prediction for 7 days under TS (MSE) | MACD prediction for 7 days under TS+Text (MSE) | Bollinger Bands prediction for 7 days under TS (MSE) | Bollinger Bands prediction for 7 days under TS+Text (MSE) | MACD prediction for 30 days under TS (MSE) | MACD prediction for 30 days under TS+Text (MSE) | Bollinger Bands prediction for 30 days under TS (MSE) | Bollinger Bands prediction for 30 days under TS+Text (MSE) | Temp. prediction max under TS (MSE) | Temp. prediction max under TS+Text (MSE) | Temp. prediction max under TS (MAE) | Temp. prediction max under TS+Text (MAE) | Temp. prediction min under TS (MSE) | Temp. prediction min under TS+Text (MSE) | Temp. prediction min under TS (MAE) | Temp. prediction min under TS+Text (MAE) | Temp. prediction diff. under TS (MSE) | Temp. prediction diff. under TS+Text (MSE) | Temp. prediction diff. under TS (MAE) | Temp. prediction diff. under TS+Text (MAE) | |
|---|---|---|---|---|---|---|---|---|---|---|---|---|---|---|---|---|---|---|---|---|---|
Loading... | |||||||||||||||||||||
Leaderboard for News-driven Question Answering
| Model | News stock corr. for 7 days 3-way (Acc) | News stock corr. for 7 days 5-way (Acc) | News stock corr. for 30 days 3-way (Acc) | News stock corr. for 30 days 5-way (Acc) | News driven MCQA for 7 days for Finance data (Acc) | News driven MCQA for 7 days for Weather data (Acc) | News driven MCQA for 30 days for Finance data (Acc) | News driven MCQA for 30 days for Weather data (Acc) | |
|---|---|---|---|---|---|---|---|---|---|
Loading... | |||||||||